
About Me
I connect data with decisions. My strength lies not just in analysis but in helping leaders understand what the numbers mean. I design clear dashboards, uncover opportunities, and turn insights into action across finance, international development, and enterprise growth. My experience running startups and leading diverse projects has strengthened my ability to think strategically, adapt to uncertainty, and turn data into real-world impact.
Skills

Excel | Tableau | Power BI | Power Automate | SQL | Python | GitHub
Data Visualization - 3+ yrs
AI for Business Analytics - 2+ yrs
Statistical Forecasting - 3+ yrs
Data Storytelling & Reporting - 3+ yrs
Financial Risk & Engineering - 2+ yrs
Team & Project Management - 5+ yrs
Featured Projects
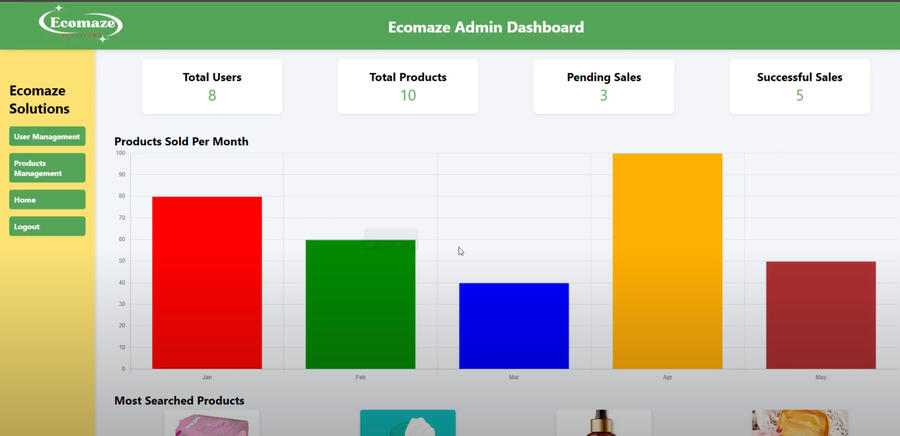
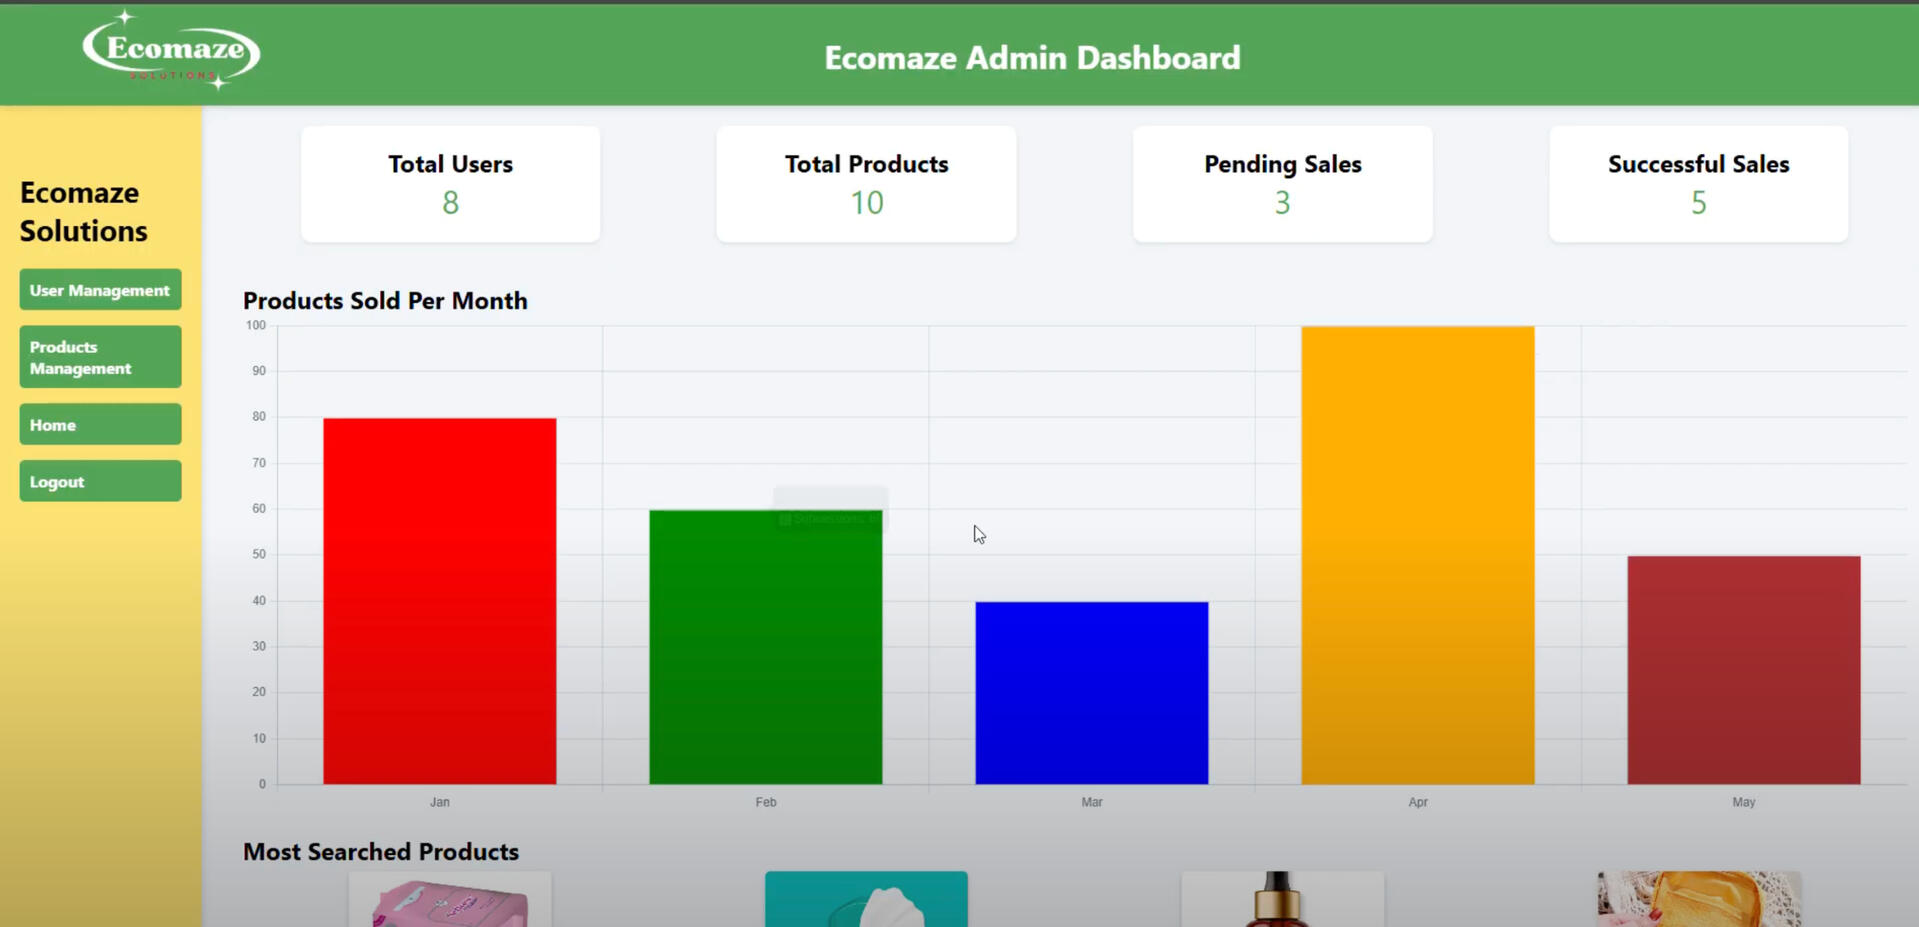
SQL | POWER BI ECO_SHOP SALES ANALYSIS
Built an e-commerce platform with an integrated admin dashboard using SQL and Power BI to analyze sales, track revenue, and monitor customer trends.

Python | ML
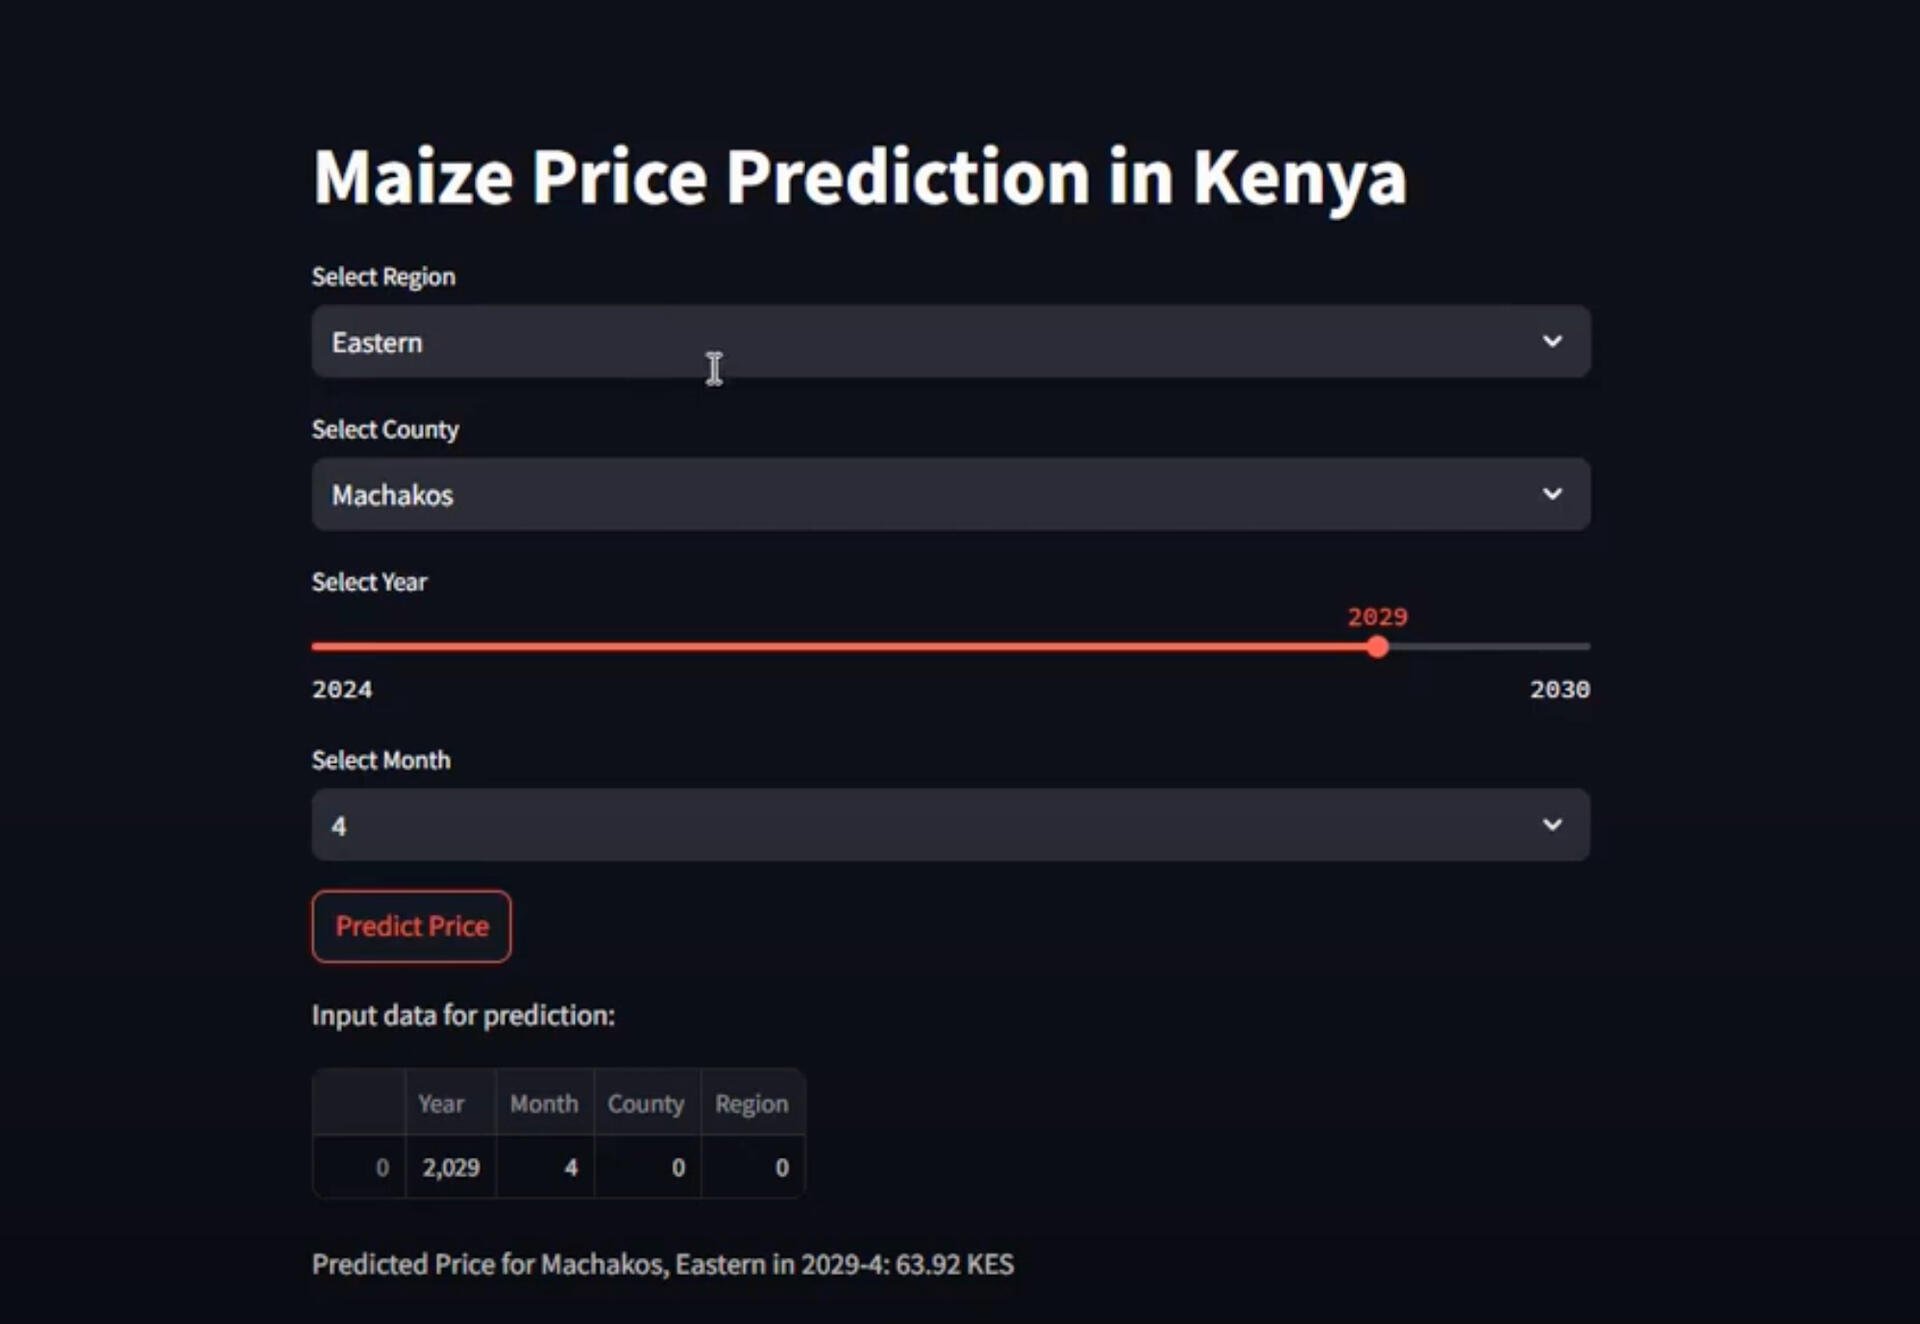
Maize Prices Prediction
Built a machine learning model in Python to predict maize prices using historical data, helping improve market planning and decision-making
Python | Power BI
Energy Monitoring App
Developed a smart energy monitoring application that analyzed IoT meter data to help households and businesses track electricity usage and reduce costs.

Excel | Tableau
Marketing Analytics
Analyzed marketing campaign data using Excel and Tableau to track performance, customer engagement, and adoption trends.
PHP | AI
Recommendation System
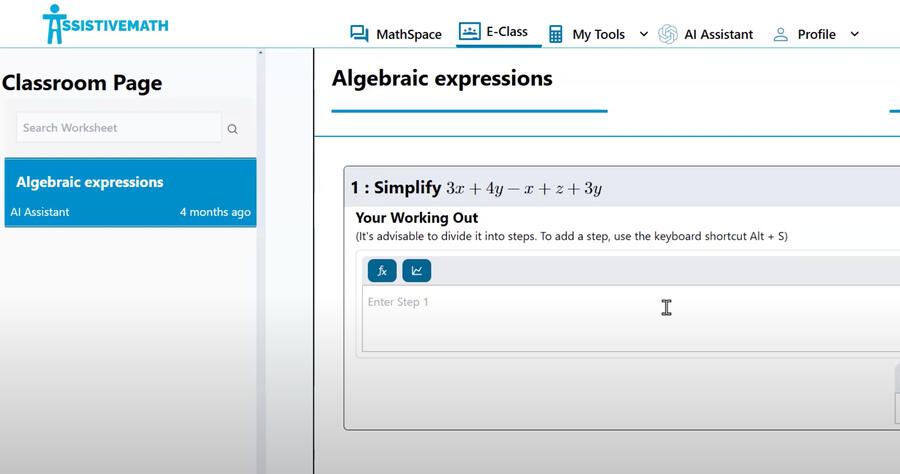
Built an AI-powered recommendation system in a real estate platform to suggest properties based on buyer preferences and improve property matching.

Work Experiences
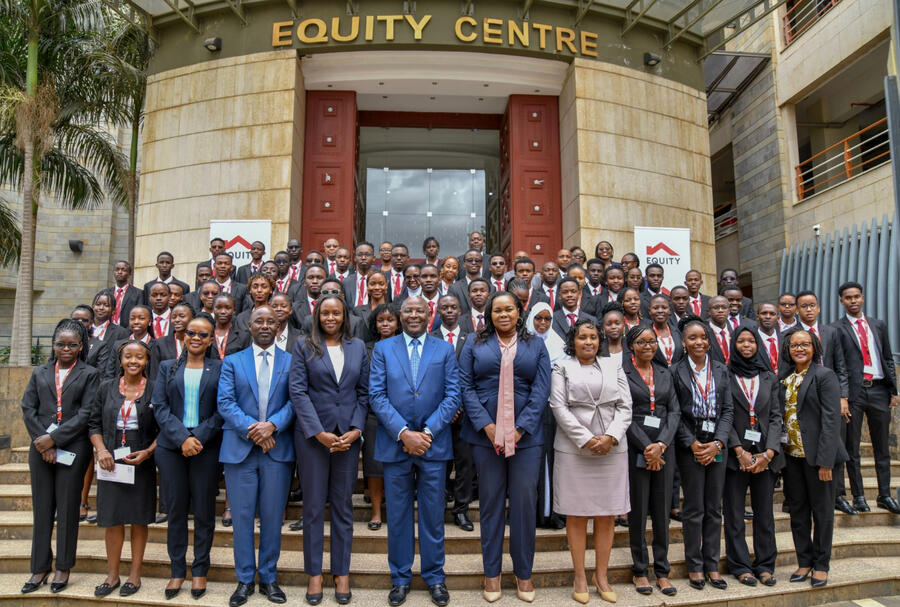
EQUITY BANK KENYA
SUMMER INTERN (JUN - AUG 2023)
Mentored global scholars in technical and professional skills while conducting data analyses that identified bottlenecks and streamlined program operations. The improvements strengthened global admissions outcomes and increased the unit’s visibility.

ECOMAZE SOLUTIONS
CO-FOUNDER & LEAD
(SEP 2023-PRESENT)
Drives vision and innovation at Ecomaze Solutions to expand affordable access to eco-friendly menstrual products through sustainable technology, leading to greater reach and reduced costs.

GOOGLE DEVELOPERS GROUP
FINANCE LEAD
(SEP 2024-SEP 2025)
Managed financial operations through timely reconciliations and clear monthly reports, improving transparency and enabling the team to deliver more events within budget.
Certifications & Awards
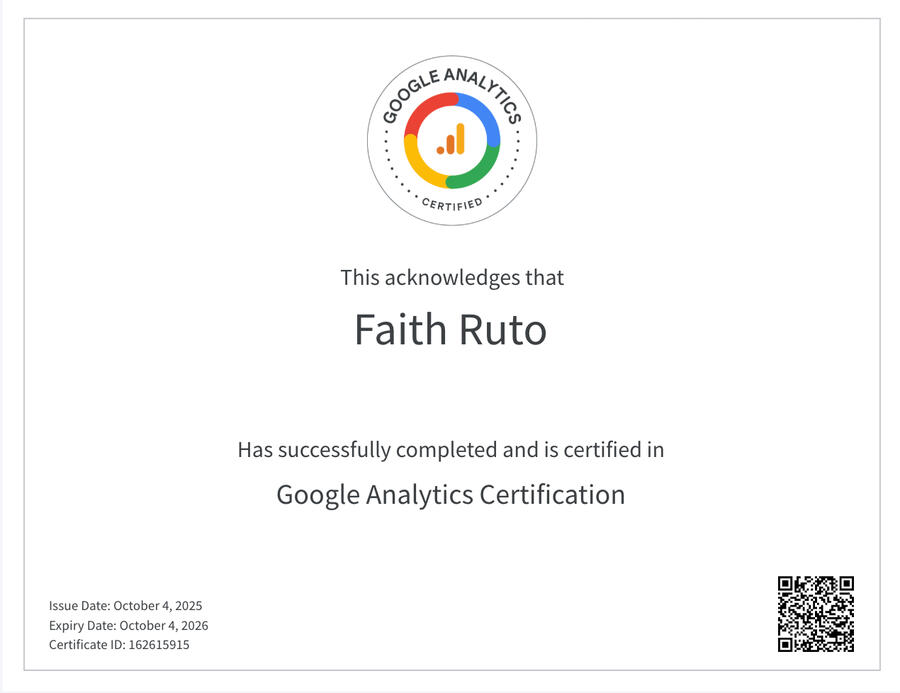
Google Analytics Certification Google | Issued 2025
Entrepreneurship | Queen’s University (Canada)
Issued 2024
Mastercard Foundation Scholarship | Ashesi University Issued 2022

2nd Runner-up in Personal Branding Competition | Ashesi University | Issued 2024

Dean's List ( Recognized for academic achievement)
Ashesi University
Professional & Community Engagements

Harvard Business Conference 2024
Boston, USA
Connected with entrepreneurs and investors exploring African opportunities and learned actionable approaches to scaling operations, structuring financing, and partnering to advance infrastructure across the continent.

Sankalp West Africa Summit 2023
Accra, Ghana
Volunteered in event operations and speaker sessions, coordinating logistics and supporting speakers while engaging with entrepreneurs and investors. The experience strengthened my coordination and communication skills while expanding my professional network.

Africa Representative (Feb 2023-Feb 2024)
Equity Global Scholars Board
Served as the African representative, coordinating program activities and liaising between African scholars and Equity Group Foundation leadership, strengthening communication and improving coordination across regions.

Msmiles Foundation
(Sep 2022-Sep 2023)
Mentorship Committee Head
Led programs supporting over 200 orphaned children by organizing skills workshops, coordinating volunteers, and providing ongoing mentorship and psychosocial support, which strengthened community engagement and improved youth confidence and life skills.
Testimonials

“In my classroom and beyond, Faith has been a model of principled leadership. She engages deeply with problems and applies design thinking thoughtfully to deliver solutions that truly serve users, with both heart and execution.”
Jewel Thompson, Head of Entrepreneurship, Ashesi University

“What stands out is Faith’s consistency. She shows up, listens with care, and does the work with dignity for every child we serve, bringing calm leadership and reliability to our programs.”
Nancy Mba, Founder, Msmiles Foundation
SQL | POWER BI ECO_SHOP SALES ANALYSIS
Questions I Wanted to Answer:
1. Which products generated the highest revenue?
2. Which months had the strongest sales performance?
3. How did customer purchasing trends evolve over time?
4. What was the contribution of repeat vs new customers?Steps I Took:
1. Pulled raw sales data from the Eco Shop database and cleaned it using SQL queries.
2. Designed relational tables to support querying by product, customer, and time.
3. Created Power BI dashboards with visualizations (bar charts, line charts, KPIs).
4. Applied filters and slicers for interactive exploration of revenue and customer data.
5. Formatted dashboards for clarity and storytelling, highlighting business insights.Key Takeaways:
1. Sales grew steadily quarter over quarter, with clear seasonal peaks.
2. A small set of products contributed disproportionately to overall revenue.
3. Customer retention was a major growth driver (repeat customers spent 40% more on average)
4. These insights supported data-driven decisions for inventory planning and targeted marketing.
Python | ML
Maize Prices Prediction
Questions I Wanted to Answer:
1. How do seasonal trends affect maize prices across different periods?
2. Can historical data be used to predict future maize prices reliably?
3. Which factors (e.g., month, demand cycles) have the most influence on price changes?
4. How accurate can a regression/ML model be in forecasting short-term price movements?Steps I Took:
1. Collected and cleaned historical maize price data for consistency and usability.
2. Performed exploratory data analysis (EDA) to identify patterns, outliers, and seasonal effects.
3. Applied statistical methods and built machine learning models (linear regression, time series forecasting) in Python.
4. Evaluated model performance using error metrics (e.g., RMSE, MAE).
5. Visualized predictions vs actual trends using Python libraries (Matplotlib, Seaborn).Key Takeaways:
1. Maize prices showed strong seasonal variation, peaking around harvest shortages.
2. Machine learning models captured historical patterns and achieved strong predictive accuracy.
3. Demonstrated how data-driven forecasting can support market stability and agricultural decision-making in emerging economies.
Python | Power BI
Energy Monitoring App
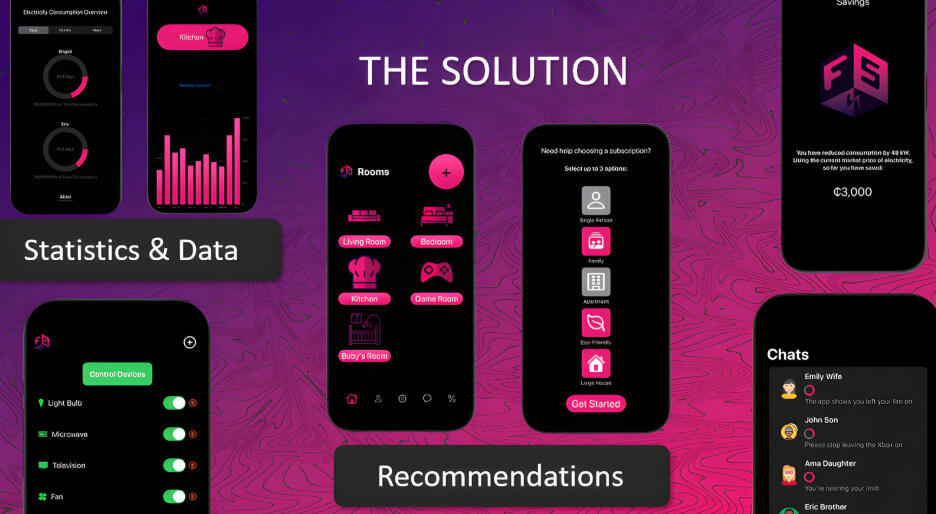
Questions I Wanted to Answer:
1. How can households and businesses track real-time electricity consumption more effectively?
2. What patterns in energy usage contribute most to high costs?
3. Can IoT meter data be used to forecast peak consumption periods?
4. How can visualizations support decision-making around energy efficiency?Steps I Took:
1. Collected energy usage data from IoT-connected device meters.
2. Used Python for data cleaning, processing, and exploratory analysis of consumption patterns.
3. Structured the data with SQL to enable queries by time, device, and user type.
4. Designed dashboards and visualizations to display trends in electricity usage and cost drivers.
5. Provided actionable insights to inform energy-saving strategies for households and businesses.Key Takeaways:
1. Identified peak consumption hours that contributed to higher energy bills.
2. Businesses showed greater potential savings by optimizing usage during non-peak hours.
3. IoT-enabled data collection improved accuracy and allowed for real-time monitoring.
4. Demonstrated how data-driven insights can reduce costs and promote sustainability in energy consumption.
Excel | Tableau
Marketing Analytics

Questions I Wanted to Answer:
1. Which marketing campaigns drove the highest user sign-ups and engagement?
2. How did user adoption change over time across different channels?
3. What customer demographics or segments responded best to campaigns?
4. Which strategies were most effective in improving product awareness and retention?Steps I Took:
1. Collected campaign data (impressions, clicks, sign-ups) and cleaned it in Excel.
2. Applied pivot tables and formulas to summarize KPIs such as conversion rates and growth trends.
3. Designed interactive dashboards to visualize user adoption, campaign effectiveness, and engagement over time.
4. Created filters and slicers to allow dynamic comparisons across channels and demographics.
5. Presented insights in a clear, business-friendly format to guide marketing strategy decisions.Key Takeaways:
1. Social media campaigns generated the most awareness, while referral campaigns produced the highest conversion rates.
2. Adoption increased steadily when campaigns combined email and social media outreach.
3. A small segment of repeat users contributed disproportionately to long-term engagement.
4. Marketing efforts became more cost-effective when strategies were refined using these insights.
PHP | AI
Recommendation System
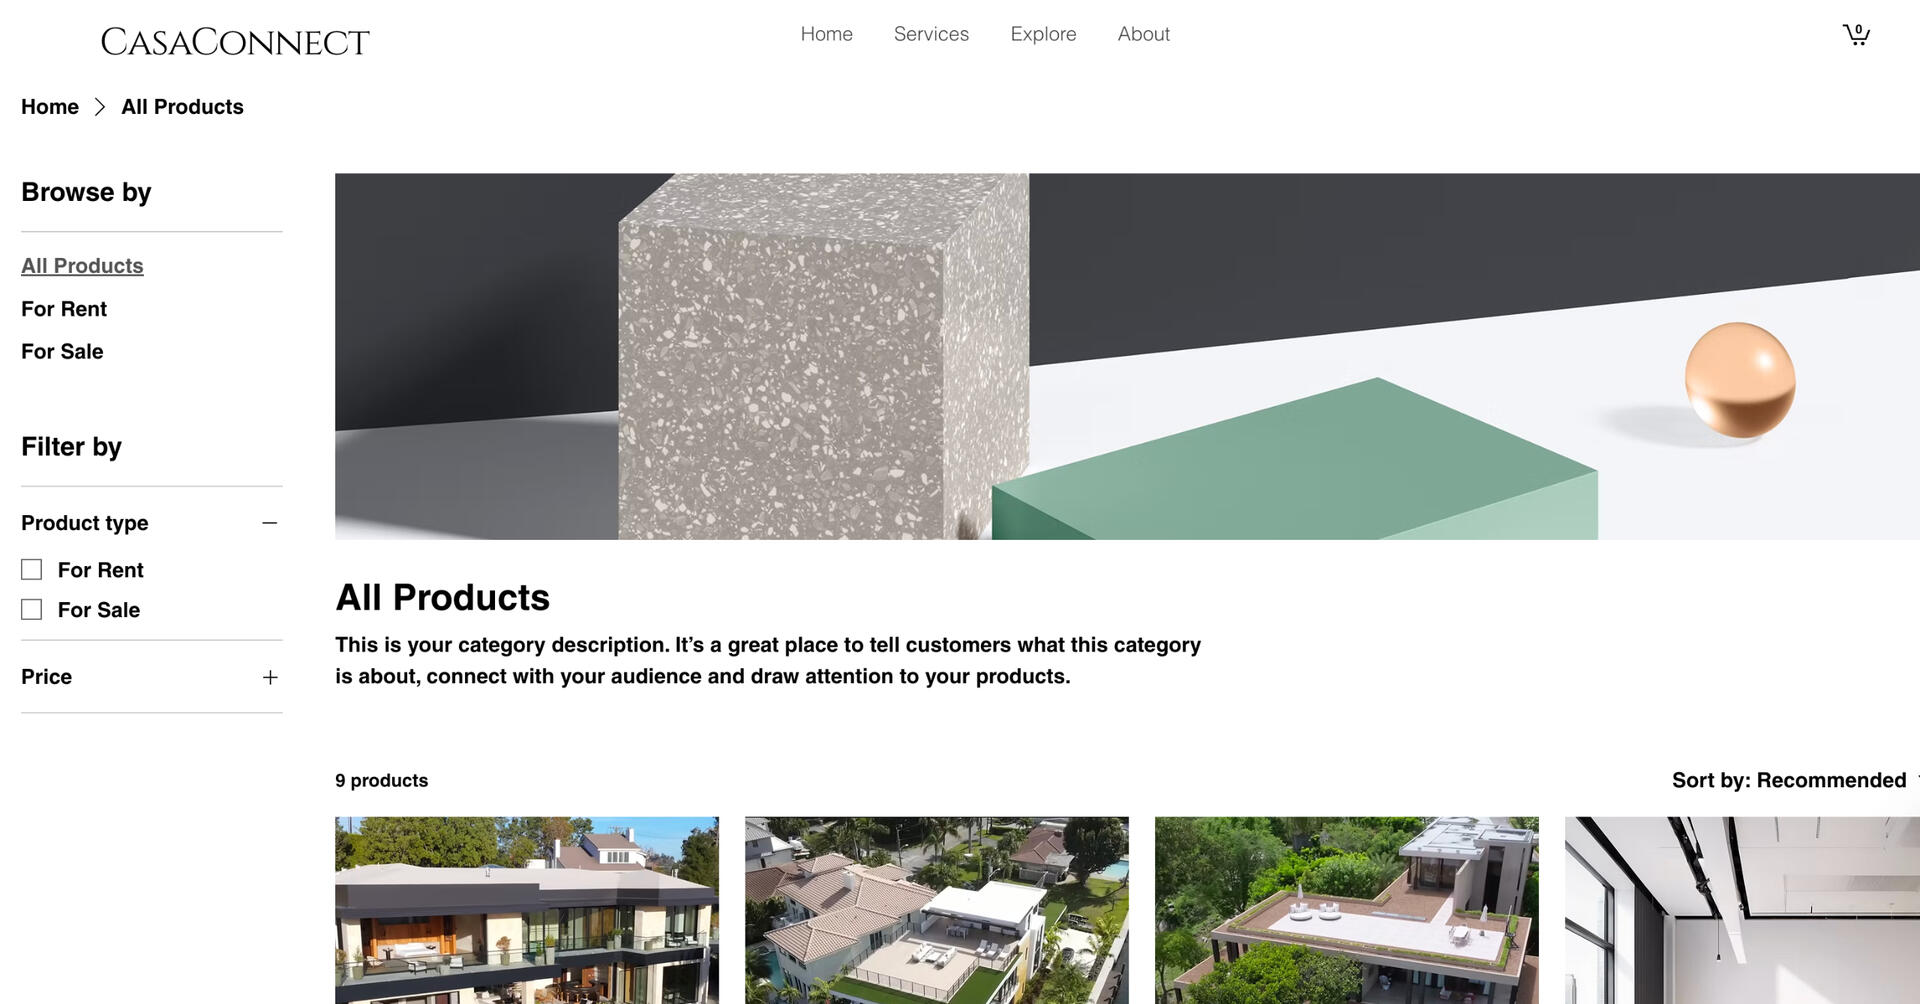
Questions I Wanted to Answer:
1. How can property seekers be matched more efficiently with listings that fit their needs?
2. Can recommendation algorithms reduce search time and improve the buyer experience?
3. What property attributes (location, price, amenities) influence matching the most?
4. How can agents gain better visibility into buyer interest and property demand trends?Steps I Took:
1. Designed the platform using PHP, SQL, and JavaScript to collect and manage property listing data.
2. Integrated recommendation algorithms to analyze buyer preferences and suggest relevant properties.
3. Applied filtering tools to allow users to refine searches by price, location, and amenities.
4. Built an admin dashboard to give agents insights into property performance and buyer interactions.
5. Optimized the system for responsiveness and interactive use across devices.Key Takeaways:
1. Personalized recommendations improved buyer-property matching, reducing time spent searching.
2. Location and price emerged as the most influential features in buyer decisions.
3. Recommendation algorithms demonstrated how AI can enhance traditional markets like real estate.
4. Showed the potential of PropTech solutions to support both buyers and agents with data-driven insights.